Sunday, September 11, 2016

MarketMood, Elliott Waves, and the Election

Last week I introduced a Presidential Campaign Momentum chart (link).  One thing that came from the discussion was a recognition of Elliott Wave patterns in this social mood derived chart.  A "b wave top" was spotted for the trajectory of Clinton's campaign and a "c wave low" for Trump.  From this labeling (shown below) we expected the next wave for Clinton to be 5 waves down.  For Trump, an up move was expected next with possibly the entire election hinging on whether the next wave set for him is a 3 wave corrective move up or a 5 wave impulsive one.  A 5 wave move up for Trump would be just the beginning of a new strong surge in the polls.

It is fascinating that we were able to call the direction of the next wave set using this combination of Elliott Waves and the MarketMood social mood data.  You have the exclusive information here that the entire presidential election could very well rest on the next week or two.  That is, not what the candidates do or say in the next week or two, but what the pattern is in the social mood data.
Looking at our momentum chart, Clinton has 3 waves down so far, and Trump 3 waves up.  They are both on a possible wave 4.  The sharp drop for Clinton does appear right for a 5 wave drop.  Today's health news could end up being a part of the 5th wave.  Trump's rally so far has more of a corrective look to it, but we will have to wait a few more days to clearly see if he is working on a 5th wave up, or beginning another 3 wave drop down.

Sunday, September 4, 2016

Presidential Technical Analysis

Just for the sake of this discussion, leave the fundamental analysis (and personal opinions about the candidates' character) at the door.  What if these were two stocks you were considering trading, and all you had was this momentum indicator?  What I see is a series of lower highs for Clinton, with current momentum at 0.  I would wait before buying this one.  The Trump stock is clearly more volatile, and the previous high was a higher high.  I would watch this one carefully for the next turn up in momentum.  However, at this point I would have to stand aside on both of them.  What would you do with these "stocks?"

Saturday, August 6, 2016

Keeping Watch on Sunday (August 7, 2016)

Overview
Sunday may be a very important day in the scheme of things, and according to the mood generated forecast, may have a significant impact on the entire week.  One thing to watch for, which will confirm a bearish immediate forecast is evidence of Sunday's Mood/Effect polarity flip.  Every 1-3 weeks, the effect of the current mood pattern inverts, and what was a positive mood brings negative effects.  Sunday should start out very positive or bullish.  At some point there should be a shift to a strong bearish mood.  This may or may not occur before futures open, but would have to occur before markets open for regular trading hours on Monday.
Qualitatively, the mood pattern points to geopolitical issues as a likely focus.  The YTD chart is pointing down through Tuesday (assuming the polarity flip occurs Sunday).


MMI Monday RTH open: down.  MMI Monday close: down (below open).

The Details

I. Stock Market Forecast
Big picture:  Looking for a sharp drop followed by a sharp rally.
Latest forecast info:
SPX MM Trend Signal MM Daily Trade Signal H.P. Trade Signal**
8/8 (open) UP DOWN NONE
8/8 UP DOWN NONE
8/9 UP DOWN NONE
**Higher Probability SPX trades have a 5-10% higher success rate than standard MMI trade signal, i.e. approximately 65-70% vs. 60-65%.
Today’s action: N/A
Hypothetical next trade: Short SPX MOO1 Monday.
1 MOO is market on open.     2 MOC is market on close.
II. Social Mood Pattern Analysis (this bonus section is provided on occasion to assist readers to gain further insight into how analysis is developed)
Themes in search trends for Sunday's mood data: movie, wrongdoing, hero, critic, criticize, image, communication, business, woman, mother, violence, death, police, technology, denial, news
Combined MoodCompass scores: .2N  .4E .8W 1.2SW 1SE .2NW =>  11% NE (Vulnerable)   39% SW (Expansive)   28% SE (Manic)  22% NW (Controlled)
Mood / Effect inversion status: Normal (since 7/31); inverts 8/7..
Qualitative Analysis notes (refer to Mood Qualities Timeline, below):   Sunday: SW high, NE low => strong bullish flips to strong bearish as inversion hits.  NE much lower than other three => watch for geopolitical escalation.  NE lowest => Not conducive to diplomacy or "nice."


Like what you see?  This is a sample post from http://marketmood.net.
Come visit!

Sunday, June 26, 2016

The Mood Pattern of Terror

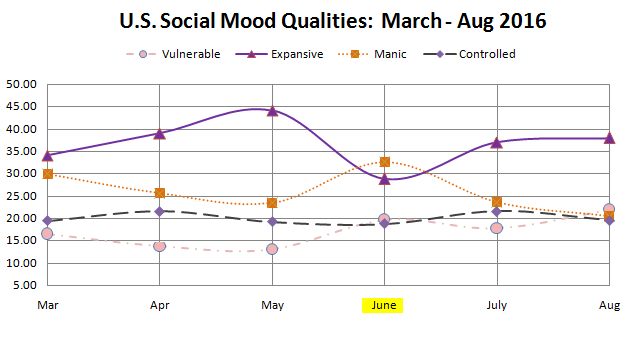
There is an identifiable social mood pattern that is associated with social disruption.  The types of events included in social disruption are protests, strikes, riots, “random” mass violence, and terrorist activity.  An example of this pattern can be seen below in the monthly mood configuration for June.  The basic pattern is high Manic and low Controlled (with mood/effect inverted as it is currently).  When the second highest mood quality is Vulnerable, it ends up being more ideological (e.g. protests and strikes).  When the second highest quality is Expansive, it tends to be more violent.
 
Time scale is important as well.  When this pattern shows up on a daily scale, the events that may arise near that date could be of little significance to the general public and may not even make the news.  On a weekly scale, something in the socially disruptive category is more likely to show up in the news.  On a monthly scale, such as what we have in June, there is almost certainty that a highly significant event or events of this type will be in the news, and will have an emotional impact, at the very least, on the American people (since the measure is U.S. mood).

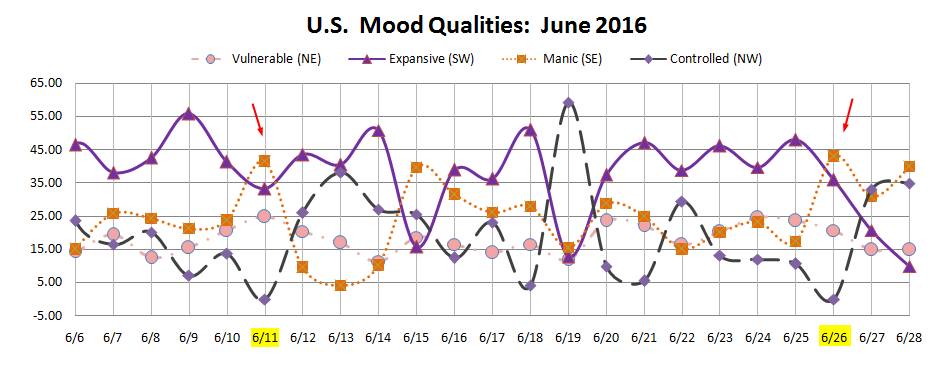
On June 12th, around 2am, the tragic and unfortunate shooting in Orlando occurred.  One can hope that the largest mass shooting in American history would be sufficient to satisfy a monthly scale disruptive mood configuration.  Yet, while not a certainty, there is an indication that something else may be next.  The exact same social mood pattern for the month of June showed up on a daily scale on June 11th, the day before the Orlando shooting.  It shows up again on June 26th (see June daily mood timeline below).  While a daily scale configuration is not usually of newsworthy significance, when it matches the larger pattern, it may be an indication of specifically when it may show up as part of the news cycle.

This is not being shared to create fear or terror.  It is a reminder to use the due diligence that is always important.  That is, staying aware of our environment and looking for unusual activity or behavior in the people around us, and for anything especially out of place.  This is especially true for the next couple of days.

How does this relate to markets and trading?  There is often (but not always) a climax event at a near term bottom, which also happens to be likely in the next few days.

Update: 6/26/16 3pm Pacific Time 
It's not terrorism, but this certainly fulfills the criteria.  Hopefully with no one dying this time: Protesters, white supremacists clash at State Capitol.  Officials: 5 people stabbed, 2 critically injured

Update: 6/28/16
No such luck.  Terrorism strikes again.
Suicide bombs kills 28, wound dozens at Istanbul airport


Friday, May 6, 2016

MarketMood Weekend: A New Paradigm

The past week has had its fill of sideways, meandering, and confusing moves.  While this may have been frustrating, there is some good news!  The mood pattern over the weekend signals a new paradigm.  This will usually signal the beginning of different market action, a new Elliott Wave subwave, a new focus, and a new news cycle.  Here’s to a new beginning in the new week!

MarketMood Indicator for Monday open: UP.    

Want to know more about what the markets might be up to next?  Go HERE.

Thursday, May 5, 2016

Not the Edge of a Cliff, Yet...

If the stock market is going to fall sharply, as some are looking for in the month of May, this isn’t the week it’s likely to happen.  While we may (or may not) be in the midst of an Elliott second wave down, from a sentiment perspective, we are hovering at a strong support line that thus far has refused to give way.  While it’s hypothetically plausible that a large market selloff could happen first, and then people would get really down in the dumps about it, mood almost always precedes market.  Right now the mood says, “No, not going down there yet.”

(click to enlarge)

The chart above shows the MarketMood Indicator daily signal vs. S&P close year to date.  Back in March through early April, the Mood Signal, after some struggle, broke above the 2100 resistance line (see chart).  In late April, the market finally reached this level, but couldn’t maintain a solid break above it.  The Mood Signal in the year to date chart here goes through this weekend (Monday open).  Once again, it’s back to this line, except from above, hovering right at support.

While markets may indeed drop tomorrow, the stock market won’t likely be able to stay dropped for long.  What the market really “wants” is to try to solidly break above that 2100 line and stay there, at least for a bit, if it can.  In order for it to “give up” on that, the Mood Signal will need to solidly break below that same line.  The message for the moment is that the Mood has not done that, and won’t do so through Monday open.

MarketMood Indicator for Friday: close down.

Want to know more about what the markets might be up to next?  Go HERE.

Monday, March 21, 2016

Global Agression, Market Correction

This week looks notably bumpy, and worthy of a special public post.  As U.S. society is a part of the global system, U.S. social mood is a subset of the global mood pattern.  There is an abrupt shift (see chart below) in the U.S. pattern showing up sometime tomorrow (Tuesday).  Slight optimism becomes passion and "mild panic" (circled in the chart).  Then by Wednesday there is a sharp deflation of spirit, as the Expansion quality quickly drops below zero, and everyone holds their breath in a tension that lasts through Thursday.  The abruptness indicates that this may show up as something quite intense.  The smallness of it reflected in the U.S. mood, may indicate that the larger effect is happening somewhere else.

In addition to this abrupt shift in mood, the MarketMood weekly model is showing a brief, but possibly sharp, market correction, of up to 2% this week.  Also, the weekly social mood (not shown) shows an aggressive configuration that often goes with geopolitical escalation.  So, hang on, there may be some turbulence.