Showing posts with label terrorism. Show all posts

Sunday, June 26, 2016

The Mood Pattern of Terror

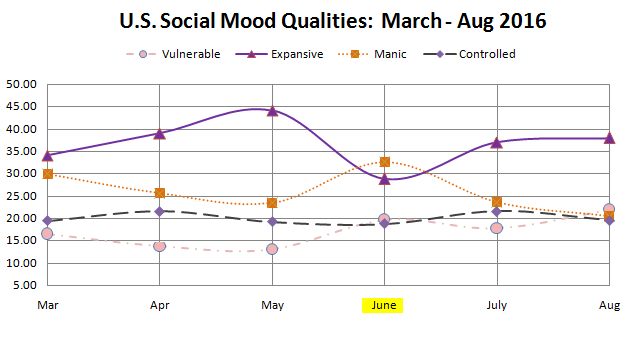
There is an identifiable social mood pattern that is associated with social disruption.  The types of events included in social disruption are protests, strikes, riots, “random” mass violence, and terrorist activity.  An example of this pattern can be seen below in the monthly mood configuration for June.  The basic pattern is high Manic and low Controlled (with mood/effect inverted as it is currently).  When the second highest mood quality is Vulnerable, it ends up being more ideological (e.g. protests and strikes).  When the second highest quality is Expansive, it tends to be more violent.
 
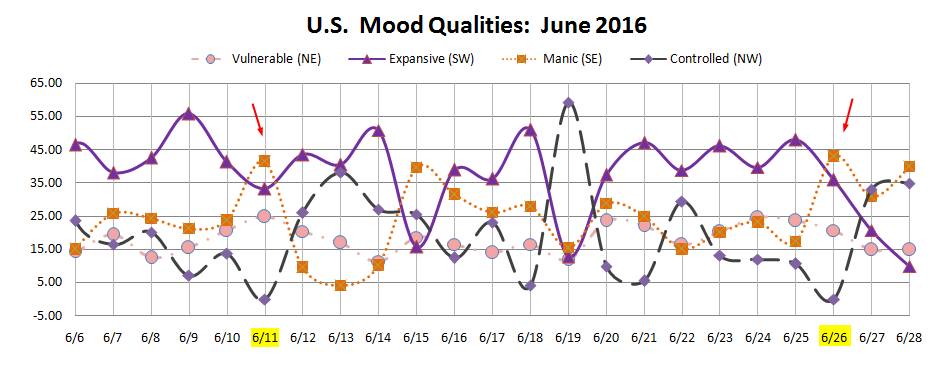
Time scale is important as well.  When this pattern shows up on a daily scale, the events that may arise near that date could be of little significance to the general public and may not even make the news.  On a weekly scale, something in the socially disruptive category is more likely to show up in the news.  On a monthly scale, such as what we have in June, there is almost certainty that a highly significant event or events of this type will be in the news, and will have an emotional impact, at the very least, on the American people (since the measure is U.S. mood).

On June 12th, around 2am, the tragic and unfortunate shooting in Orlando occurred.  One can hope that the largest mass shooting in American history would be sufficient to satisfy a monthly scale disruptive mood configuration.  Yet, while not a certainty, there is an indication that something else may be next.  The exact same social mood pattern for the month of June showed up on a daily scale on June 11th, the day before the Orlando shooting.  It shows up again on June 26th (see June daily mood timeline below).  While a daily scale configuration is not usually of newsworthy significance, when it matches the larger pattern, it may be an indication of specifically when it may show up as part of the news cycle.

This is not being shared to create fear or terror.  It is a reminder to use the due diligence that is always important.  That is, staying aware of our environment and looking for unusual activity or behavior in the people around us, and for anything especially out of place.  This is especially true for the next couple of days.

How does this relate to markets and trading?  There is often (but not always) a climax event at a near term bottom, which also happens to be likely in the next few days.

Update: 6/26/16 3pm Pacific Time 
It's not terrorism, but this certainly fulfills the criteria.  Hopefully with no one dying this time: Protesters, white supremacists clash at State Capitol.  Officials: 5 people stabbed, 2 critically injured

Update: 6/28/16
No such luck.  Terrorism strikes again.
Suicide bombs kills 28, wound dozens at Istanbul airport


Monday, March 21, 2016

Global Agression, Market Correction

This week looks notably bumpy, and worthy of a special public post.  As U.S. society is a part of the global system, U.S. social mood is a subset of the global mood pattern.  There is an abrupt shift (see chart below) in the U.S. pattern showing up sometime tomorrow (Tuesday).  Slight optimism becomes passion and "mild panic" (circled in the chart).  Then by Wednesday there is a sharp deflation of spirit, as the Expansion quality quickly drops below zero, and everyone holds their breath in a tension that lasts through Thursday.  The abruptness indicates that this may show up as something quite intense.  The smallness of it reflected in the U.S. mood, may indicate that the larger effect is happening somewhere else.

In addition to this abrupt shift in mood, the MarketMood weekly model is showing a brief, but possibly sharp, market correction, of up to 2% this week.  Also, the weekly social mood (not shown) shows an aggressive configuration that often goes with geopolitical escalation.  So, hang on, there may be some turbulence.


Monday, October 26, 2015

Social Mood and Stock Market Abnormally MANIC!

Social mood (as well as the stock market) has ups and downs, but arising in the last couple of days, a MANIC spike is concerning.  The chart below shows a normal range of ups and down in social mood factors since August.  The spike showing up is clearly NOT NORMAL.  Manic mood often accompanies instability, protests, and sometimes terrorist activity.  A "crazy" news event of some type is likely.
 
Update: 31 Oct 2015 Russian jet downed by ISIS That definitely is Not Normal and terrorist activity.
 
(click to enlarge)
 
The stock market is clearly overly excited as well.  The daily social mood signal is at resistance and doesn't seem to be able to break through.  The stock market has continued to move higher in spite of the anxiety the public is experiencing. Either people are about to be feeling a whole lot better, or the market is going to hit a wall.


(click to enlarge)

Thursday, July 24, 2014

U.S Disaster, 1st Week of August, 2014

A U.S. disaster signal has been detected by the MoodCompass Project team after many months of little to no U.S. disaster activity.  It should be of significant emotional impact to most people within the U.S., and will most likely include loss of life greater than seen in average news stories; economic losses are also likely.

We will wait a few more days before presenting further information about the likely type of disaster while we sift through our data, and get additional information.

A disaster signal is generated when the relationship between U.S. social focus (social mood measured by top Google Hot Trends) and social mood factors found in the top U.S. news stories meets certain criteria.  You can see in the chart below, that the U.S. disaster mood factor today spiked up from the low range area it normally hovers in.  This means that there is a significant risk of a U.S. disaster in the near future, most likely between 7 and 14 days from now, or August 1 - 8.

(click to enlarge)
 
The second chart (below), is a snap shot of the intensity of these factors.  The greatest specific threat showing up as of today is mass violence or terrorism.  However, we will be getting more information in the next few days.
 
(click to enlarge) 


Thursday, February 13, 2014

Party's about Over: Outlook 14 Feb '14

after market update: actual S&P +8.81  Markets are seriously overbought.  Will the rally continue much longer?  Watch for the update Monday near 12am ET.

(click to enlarge)

- - -
Overview:  Collective mood indicates the ending of a chapter, and a struggle to hold onto optimism that looks about to be lost.  Mood signals for the day indicate a sell off in the markets is likely.  We've been watching for a high impact U.S. disaster or tragic event since late January.  Will the current ice storm have enough impact to get us out of this disaster zone, or will pressure continue to build only to erupt in something bigger?  We will know in a few days.

Near Term: While markets have rallied quite a bit in the past few days, social mood signals have been hovering in the 1740-1760 area (see Google trends chart below).  The mood signal is now just below support which may indicate an imminent break down.   
 
Long Term: Collective mood has been in a many month long process of topping.  Long term indicators are flashing "extreme caution," and are just below support, indicating a significant breakdown may be in progress.  The impact of human and natural disasters has been relatively low, but the trend is toward increasing impact.  Over time, this may wear on both mood and socioeconomic stability.
 
Today's Signals: -11.7 from Google Hot Trends, -1.4 from Themes in the News.  The projected stock market change for today is shown in the chart below.

 (click to enlarge)
 
 
Mood signals from Google Hot Trends: On a daily basis, markets tend to follow social mood more often than not.  Overall, social mood trend changes usually precede market trend changes.
 
  (click to enlarge)


Mood signals from themes in the news: News tends to follow the general trend of the market, but on a daily basis, can either lead or lag the movement of the market.    
 

(click to enlarge)
 
 
Note: data for U.S. social mood are scores in eight MoodCompass categories of Google Hot Trends, data for news are scores of top Google U.S. news stories.  Scores are converted to 4 inputs to the Market Mood Model.  The output is a conversion of mood data to estimated S&P point change.  Stock market data source: Google Finance.  This is posted as a public service, and to enhance exposure to our research.  It is not intended to be trading advice.

Wednesday, February 12, 2014

Is Pax the Big U.S. Disaster?

The graph below shows the scale of disaster that is likely to occur if the anticipated disaster or tragedy occurs on 14 February or later (under that is the graph for before 14 February).  Will storm Pax claim another 10 or even more lives in the next day or two, or will pressure continue to build, creating an even larger disaster in another few weeks?  That is the current question being asked as the current social mood data is compared with previous disasters.
 
(click to enlarge)

(click to enlarge)

Since late January, after Storm Leon, a United States disaster has been "waiting" to happen.  The chart below shows the divergence between U.S. collective mood and mood themes in top U.S. news stories since July 2012.  Recently, there has been an amazing repeating occurrence of severe ice storms the next two times the line in this chart got into the same area as Leon.  Nika was bad, but Pax looks like it could be worst of all.

(click to enlarge)

Storm Nika did not relieve the "pressure" that would have been released if that was the disaster.   After the Boston Marathon bombing, the Navy Yard shooting of a few months ago, and even the Arapahoe High School shooting, there is a noticeable drop in the chart marked by an orange line.  This has not yet occurred in this cluster.

The most likely type of event expected, as indicated by current collective mood patterns is type NE.  This would probably be an economic event, or a Winter Storm if a natural event is the disaster.  Looking at the pattern occurring for this entire cluster, the most likely event would be type NE and SW.  This would likely be an international economic event that impacts the United States, a geopolitical escalation that the U.S. feels victimized by (e.g. act of war or internationally sponsored terrorist attack), or, if a natural event, a Winter Storm with heavy precipitation and winds.

Is Pax finally going to be the event that relieves this building pressure?  It certainly fits the type, and some are saying that Pax may be one for the history books, but our suspicions are that something else is still to come.  Yet, Pax could be the big disaster that will get rid of this growing monster of potential.  The only way to know for sure will be after the fact.  If a sharp drop shows up in the chart (i.e. the orange "release" lines) then we will know it was the big one.  Whatever shows up as the disaster or tragic event when it does appear, will impact us all on some level.  It will be something everyone talks about for days.
- - -
Update 2/14/14: Pax death toll is estimated at 25.  There were record flight cancellations, a 100 car pile up in Pennsylvania, and economic losses from closures of shops, transportation, etc.
Winter storm leaves 25 dead in US East Coast, more than 2100 flights cancelled.  Fatality estimates from social mood data (see charts at top) was 18 through February 14, and 27 if the event after February 14.  Something much bigger than Pax is coming if it was not "bad enough" to relieve the disaster pressure.  It fit the estimate, so perhaps this might be it.   In the next day or two we should know.

Outlook 13 Feb '14

after market update: actual S&P +10.6  Markets are seriously overbought, and a U.S. disaster is preparing to hit?  Will the rally continue much longer?

(click to enlarge)

- - -
Overview:  Collective mood indicates the ending of a chapter, and a desperate fight to hold onto optimism.  Mood signals for the day indicate a light rally in the markets is possible.  However, markets are extremely overbought relative to daily social mood signals.  We've been watching for a high impact U.S. disaster or tragic event since we learned that the last big ice storm (Nika) was not enough to dissipate the disaster pressure showing up in collective mood.  Will the current ice storm have enough impact to get us out of this zone, or is there more?  We will know in a few days.

Near Term: While markets have rallied quite a bit in the past few days, social mood signals are still hovering in the 1740-1760 area (see Google trends chart below).  The mood signal should break out in the next few days to give us a heads up on trend for the near term. 
 
Long Term: Collective mood has been in a many month long process of topping.  Long term indicators are flashing "extreme caution," and are just below support, indicating a significant breakdown may be in progress.  The impact of human and natural disasters has been relatively low, but the trend is toward increasing impact.  Over time, this may wear on both mood and socioeconomic stability.
 
Today's Signals: +7.0 from Google Hot Trends, +0.2 from Themes in the News.  The projected stock market change for today is shown in the chart below.

 (click to enlarge)
 
 
Mood signals from Google Hot Trends: On a daily basis, markets tend to follow social mood more often than not.  Overall, social mood trend changes usually precede market trend changes.
 
  (click to enlarge)


Mood signals from themes in the news: News tends to follow the general trend of the market, but on a daily basis, can either lead or lag the movement of the market.    
 

(click to enlarge)
 
 
Note: data for U.S. social mood are scores in eight MoodCompass categories of Google Hot Trends, data for news are scores of top Google U.S. news stories.  Scores are converted to 4 inputs to the Market Mood Model.  The output is a conversion of mood data to estimated S&P point change.  Stock market data source: Google Finance.  This is posted as a public service, and to enhance exposure to our research.  It is not intended to be trading advice.

Tuesday, February 11, 2014

Outlook 11 Feb '14

Overview:  Collective mood indicates increasing risk of violence, protests and terrorist activity.  Mood signals for the day indicate a moderate selloff in the markets is likely.  Yesterday's information confirmed suspicions that a high impact U.S. disaster or tragic event is within a week to ten days away. The big ice storm known as Nika along with power outages and state disaster declarations last week was not enough to dissipate the disaster pressure.  More details will be presented in a few days of likely event type and timing.

Near Term: The social mood trend had been turning down sharply, and bounced at support near S&P 1740 (see Google trends chart below).  It has recently broken down below that support indicating further downside in the markets is likely. 
 
Long Term: Collective mood has been in a many month long process of topping.  Long term indicators are flashing "extreme caution," and are just below support, indicating a significant breakdown may be in progress.  The impact of human and natural disasters has been relatively low, but the trend is toward increasing impact.  Over time, this may wear on both mood and socioeconomic stability.
 
Today's Signals: -5.1 from Google Hot Trends, -3.1 from Themes in the News.  The projected stock market change for today is shown in the chart below.

 (click to enlarge)
 
 
Mood signals from Google Hot Trends: On a daily basis, markets tend to follow social mood more often than not.  Overall, social mood trend changes usually precede market trend changes.
 
  (click to enlarge)


Mood signals from themes in the news: News tends to follow the general trend of the market, but on a daily basis, can either lead or lag the movement of the market.    
 

(click to enlarge)
 
 
Note: data for U.S. social mood are scores in eight MoodCompass categories of Google Hot Trends, data for news are scores of top Google U.S. news stories.  Scores are converted to 4 inputs to the Market Mood Model.  The output is a conversion of mood data to estimated S&P point change.  Stock market data source: Google Finance.  This is posted as a public service, and to enhance exposure to our research.  It is not intended to be trading advice.

Sunday, February 9, 2014

Violence and Volatility: Outlook 10 Feb '14

after market update: actual S&P +2.8  So far, markets have been ignoring the turndown in social mood.  Will it continue much longer?


(click to enlarge)
- - -
Overview:  Collective mood indicates increasing risk of violence, protests and terrorist activity.  Mood signals for the day indicate a moderate to sharp selloff in the markets is likely.  Today's information confirmed suspicions that a high impact U.S. disaster or tragic event is within a week to ten days away. The big ice storm known as Nika along with power outages and state disaster declarations last week was not enough to dissipate the disaster pressure.  More details will be presented in a few days of likely event type and timing.

Near Term: The social mood trend had been turning down sharply, and bounced at support near S&P 1740 (see Google trends chart below).  It has recently broken down below that support indicating further downside in the markets is likely. 
 
Long Term: Collective mood has been in a many month long process of topping.  Long term indicators are flashing "extreme caution," and are just below support, indicating a significant breakdown may be in progress.  The impact of human and natural disasters has been relatively low, but the trend is toward increasing impact.  Over time, this may wear on both mood and socioeconomic stability.
 
Today's Signals: -14.3 from Google Hot Trends, -14.2 from Themes in the News.  The projected stock market change for today is shown in the chart below.

(click to enlarge)
 
 
Mood signals from Google Hot Trends: On a daily basis, markets tend to follow social mood more often than not.  Overall, social mood trend changes usually precede market trend changes.
 
  (click to enlarge)


Mood signals from themes in the news: News tends to follow the general trend of the market, but on a daily basis, can either lead or lag the movement of the market.    
 

(click to enlarge)
 
 
Note: data for U.S. social mood are scores in eight MoodCompass categories of Google Hot Trends, data for news are scores of top Google U.S. news stories.  Scores are converted to 4 inputs to the Market Mood Model.  The output is a conversion of mood data to estimated S&P point change.  Stock market data source: Google Finance.  This is posted as a public service, and to enhance exposure to our research.  It is not intended to be trading advice.

Thursday, February 6, 2014

Outlook 7 Feb '14

after market update: actual S&P +23.6  Markets kept on going today, far exceeding the social mood signals' take on things, and in spite of a dreary payrolls report.


(click to enlarge)
- - -
Overview:  Collective mood indicates rising uncertainty and increased risk of violence, protests and terrorist activity.  Mood signals for the day indicate a continued selloff in the markets is likely.  The clear indication that the disaster pressure had been resolved is unfortunately missing.  It is not clear at this time whether or not there is still more to come.

Near Term: The social mood trend had been turning down sharply, but after briefly bouncing off support had been scraping along it near S&P 1740 (see Google trends chart below).  It has recently broken down below that support indicating further downside in the markets is likely. 
 
Long Term: Collective mood has been in a many month long process of topping.  Long term indicators are flashing "extreme caution," yet may be pausing at long term support.  The impact of human and natural disasters has been relatively low, but the trend is toward increasing impact.  Over time, this may wear on both mood and socioeconomic stability.
 
Today's Signals: -5.8 from Google Hot Trends, -11.5 from Themes in the News.  The projected stock market change for today is shown in the chart below.

(click to enlarge)
 
 
Mood signals from Google Hot Trends: On a daily basis, markets tend to follow social mood more often than not.  Overall, social mood trend changes usually precede market trend changes.
 
  (click to enlarge)


Mood signals from themes in the news: News tends to follow the general trend of the market, but on a daily basis, can either lead or lag the movement of the market.    
 

(click to enlarge)
 
 
Note: data for U.S. social mood are scores in eight MoodCompass categories of Google Hot Trends, data for news are scores of top Google U.S. news stories.  Scores are converted to 4 inputs to the Market Mood Model.  The output is a conversion of mood data to estimated S&P point change.  Stock market data source: Google Finance.  This is posted as a public service, and to enhance exposure to our research.  It is not intended to be trading advice.

Wednesday, February 5, 2014

Climax: Outlook 6 Feb '14

after market update: actual S&P +21.8  Markets were way up today in line with the resolution and "climax" signals we were picking up (see below).  It may be that the recent winter ice storm in the U.S. which resulted in disaster declarations in several states, and with hundreds of thousands still without power, IS the resolution of the disaster signal (along with the market recovery).  It was mentioned that a natural event would likely be volcano or flood (i.e. heavy precipitation), and the plentiful ice breaking power lines and trees would fit this, although it was not specifically considered.  We are still looking for a clear resolution signal to know this pattern is fully completed.


(click to enlarge)
- - -

Overview:  Collective mood indicates rising uncertainty and increased risk of violence, protests and terrorist activity.  Mood signals for the day indicate a continued selloff in the markets is more likely than not.  The U.S. disaster or major tragic event signals we have discussed (see 31 Jan. post), appear to be resolving.  We will discuss this further at the end of the day.

Near Term: The social mood trend had been turning down sharply, but after briefly bouncing off support has been scraping along it near S&P 1740 (see Google trends chart below).  It has now broken down below that support indicating further downside in the markets is likely. A climax followed by a near term bottom may be quickly approaching.  There is strong support near S&P 1725 if the 1740 area doesn't hold.
 
Long Term: Collective mood has been in a many month long process of topping.  Long term indicators are flashing "extreme caution," yet seem to be pausing at long term support.  The impact of human and natural disasters has been relatively low, but the trend is toward increasing impact.  Over time, this may wear on both mood and socioeconomic stability.
 
Today's Signals: -5.5 from Google Hot Trends, -0.8 from Themes in the News.  The projected stock market change for today is shown in the chart below.

(click to enlarge)
 
 
Mood signals from Google Hot Trends: On a daily basis, markets tend to follow social mood more often than not.  Overall, social mood trend changes usually precede market trend changes.
 
  (click to enlarge)


Mood signals from themes in the news: News tends to follow the general trend of the market, but on a daily basis, can either lead or lag the movement of the market.    
 

(click to enlarge)
 
 
Note: data for U.S. social mood are scores in eight MoodCompass categories of Google Hot Trends, data for news are scores of top Google U.S. news stories.  Scores are converted to 4 inputs to the Market Mood Model.  The output is a conversion of mood data to estimated S&P point change.  Stock market data source: Google Finance.  This is posted as a public service, and to enhance exposure to our research.  It is not intended to be trading advice.

Tuesday, February 4, 2014

Next "U.S." Disaster could be the Sochi Olympics

(click to enlarge)

A few days ago, we were wondering if the Superbowl might be the next major U.S. tragedy.  However, as we mentioned in the post, it seemed more likely that it would be an event with an international component.  The Sochi Olympics has the international component and is related to sports.  This imminent disaster, however it will manifest, still appears to be quickly approaching.

To repeat what was said in the earlier post: the Disaster Curve (see above) peaked on 31 January 2014.  This means that if the pattern continues as it has over the past couple of years, the next major U.S. tragic event is imminent.  The Boston Marathon bombing occurred 6 days after the peak immediately before it.  The Navy Yard shooting several months ago occurred only 1 day after the peak preceding it.  We are now on day 4.

The type of disaster or tragic event can take many forms, but the current social mood pattern can often give us clues.  The current pattern indicates that it will likely be type SW.  This is associated with international events, the military, acts of war, sports, and leadership (e.g. the President or high ranking U.S. leader).  Should there be a natural U.S. event on the horizon, type SW is most often associated with a volcano or flood.  Globally, there may be disasters or tragic events during this period that are also of this same type.

While the event doesn't have to be related to sports, the Sochi Olympics as disaster would fit several of the key themes listed above for type SW.  Let us hope and pray that the athletes and spectators stay out of harms way.  We will know soon enough what this disaster curve has been trying to tell us.

Saturday, February 1, 2014

Next U.S. tragedy: Is it the Superbowl?

(click to enlarge)

The Disaster Curve (see above) peaked on 31 January 2014.  This means that if the pattern continues as it has over the past couple of years, the next major U.S. tragic event is imminent.  The Boston Marathon bombing occurred 6 days after the peak immediately before it.  The Navy Yard shooting several months ago occurred only 1 day after the peak preceding it. 

The type of disaster or tragic event can take many forms, but the current social mood pattern can often give us clues.  The current pattern indicates that it will likely be type SW.  This is associated with international events, the military, acts of war, sports, and leadership (e.g. the President or high ranking U.S. leader).  Should there be a natural U.S. event on the horizon, type SW is most often associated with a volcano or flood.  Globally, there may be disasters or tragic events during this period that are also of this same type.

While sports is one of the listed probable types of events, and Superbowl Sunday is only two days away, that does not necessarily mean that the Superbowl will be subject to attack, yet it does merit a close watch.  It is likely that whatever occurs has an international component or leads to war or the brink of war.  We will have to see how this shapes up over the next few days.
- - -
Update 1 Feb '14: Here's the volcano, but not the U.S. thing yet.
                             Wow!  Another one!
Update 5 Feb '14: Storm Nika-- "flood" or heavy precipitation of ice and snow with near record power outages.

Friday, January 31, 2014

U.S. Disaster Nears: Outlook 31 January '14

after market update: actual S&P -11.6  The market was moderately down, in line with social mood signals.  When the disaster signal peaks indicating a U.S. tragic event is imminent, we will announce that.  Hopefully, it has nothing to do with the upcoming Superbowl this weekend. 


(click to enlarge)
- - -
Overview:  Collective mood shows aggression, and perceptions of deterioration.  Mood signals for the day indicate a moderate decline in the markets is likely.  A U.S. disaster or major tragic event is a few days away (see 28 Jan. post).  The curve we have been waiting to top is showing signs of peaking, but has not yet turned down.  When it does, the anticipated event becomes imminent (within a day or two).
Near Term: Global mood trends imply a profound transformation in the global landscape taking place in the background.  It may be another few days to a few weeks to know all that this is pointing to.  The social mood trend had been turning down sharply, but after briefly bouncing off support has been scraping along it (see Google trends chart below).  
 
Long Term: Collective mood has been in a many month long process of topping.  Long term indicators are flashing "caution," yet there is no definitive signal that a major market shift is imminent.  The impact of human and natural disasters of late has been relatively low, but the trend is toward increasing impact.  Over time, this may wear on both mood and socioeconomic stability.
 
Today's Signals: -7.3 from Google Hot Trends, -2.1 from Themes in the News.  The projected stock market change for today is shown in the chart below.

(click to enlarge)
 
 
Mood signals from Google Hot Trends: On a daily basis, markets tend to follow social mood more often than not.  Overall, social mood trend changes usually precede market trend changes.
 
  (click to enlarge)


Mood signals from themes in the news: News tends to follow the general trend of the market, but on a daily basis, can either lead or lag the movement of the market.    
 

(click to enlarge)
 
 
Note: data for U.S. social mood are scores in eight MoodCompass categories of Google Hot Trends, data for news are scores of top Google U.S. news stories.  Scores are converted to 4 inputs to the Market Mood Model.  The output is a conversion of mood data to estimated S&P point change.  Stock market data source: Google Finance.  This is posted as a public service, and to enhance exposure to our research.  It is not intended to be trading advice

Wednesday, December 25, 2013

U.S. Mass Violence Threat Resolves: Outlook 26 December '13

after market update: actual S&P +8.7 (+0.5%).   Markets again continued up.  The divergence between social mood and markets is at extreme levels.  An abrupt shift is getting more likely.

(click to enlarge)
- - -
Overview: There has been a collective mood pattern coinciding with risk of small scale mass violence that has continued to linger since just before the Arapahoe High School shooting.  It is finally showing a resolution (all clear) as of tomorrow.  The social mood pattern for today reflects holiday merry making, but also self sacrifice for a cause.  Themes in the news reflect vulnerability to violence or attack.  Markets are near a "ceiling" area.
 
Mass Violence Threat:  Since December 8, 2013 a collective mood pattern coinciding with U.S. disasters and mass violent incidents has been observed and discussed here.  Of particular interest is the pattern observed with the Boston Marathon event, the Navy Yard Shooting, and the recent  Arapahoe High School shooting (see chart below).  The Boston Marathon was followed by the W. Texas fertilizer plant explosion, and then was resolved (shown by the orange line).  The resolution in the pattern after the Navy Yard shooting is shown by an orange line.  The Arapahoe High School shooting was followed by the Reno Hospital shooting.  Until the orange line shown for the 26th, there has been no resolution and another event has been anticipated.  As of the 26th, this pattern can be considered resolved.
 
 (click to enlarge)

Today's Market Outlook is slightly up to moderately down ( -0.1% to +0.1% ).  Both the social mood signal and the signal from themes in the news are slightly on either side of unchanged, yet the market is overbought relative to social mood giving a slight edge to the downside.  The projected stock market change for today is shown in the chart below.

 (click to enlarge)
 
Near term mood outlook:  aggression reflects holiday merry making, but also self sacrifice for a cause.  Themes in the news reflect vulnerability to violence or attack.  The combined pattern of news and social mood reflects general "bad news."  
 
Near term market outlook: The social mood signal is indicating a serious downturn in social mood that is likely to be followed by the markets. The signal is at a significant resistant point and may have difficulty moving up further-- i.e. markets may be hitting a "ceiling."
 
Longer term outlook: The overall social mood trend has been in what appears to be a topping process for many months.  This topping process appears to be in its final stages.  A sharp market drop of more than 15% indicated by long term mood and market charts, may be near.
 
Today’s social mood signal is +1.2 S&P points as of the time of this posting.  On a daily basis, markets tend to follow social mood more often than not.  Overall, social mood trend changes often precede market trend changes.
 
  (click to enlarge)


Today’s news signal is -1.6 S&P points as of the time of this posting.  News tends to follow the general trend of the market, but on a daily basis, can either lead or lag the movement of the market.    
 

(click to enlarge)
 
 
Note: data for U.S. social mood are scores in eight MoodCompass categories of Google Hot Trends, data for news are scores of top Google U.S. news stories.  Scores are converted to 4 inputs to the Market Mood Model.  The output is a conversion of mood data to estimated S&P point change.  Stock market data source: Google Finance.  This is posted as a public service, and to enhance exposure to our research.  It is not intended to be trading advice.

Sunday, December 8, 2013

The Next American Tragedy... A Few Days Away?

America's next big tragedy may be only a few days away.  This has been detected by observing changes in social mood, and in the divergence between themes in the news and how people collectively are feeling.  For more details on how this is detected, see Disasters: Society's Shadow.  For more details on where America is now, and this particular alert, keep reading.

The chart below is one of the ways we watch the changes in social mood relative to the news.  A pattern emerged prior to every major tragic U.S. event since July 2012.  You will see one of the black dots, labeled Karma Point, followed by a red dot, labeled Tragic Event or Disaster.   The exception to this is that immediately following the very impactful Boston Marathon event and out through September of this year, there was a disruption in the pattern.


If the previous pattern has returned, as appears from the Navy Yard shooting in September, then America is days away from its next big tragedy.  We will be able to discover within a few days, if this is true, or if there is some unidentified new pattern (or no pattern) in play.  Another interesting feature that has been noticed in the last few disaster clusters is a possible relationship between stormy weather and the immediately following tragic events. 

In April 2013, immediately preceding the Boston Marathon event, was a disruptive and damaging storm, and this line on the graph peaked.
In September 2013, immediately preceding the Navy Yard Shooting, there was a major flooding event in Western Colorado.


Now, in December 2013, after the prerequisite black dot on the graph (Karma Point), there are disruptive and damaging ice storms.  The big question is, does this line now peak, with a major U.S. tragedy immediately afterwards?  We will know in a few days.